 Edgebook
Dashboard
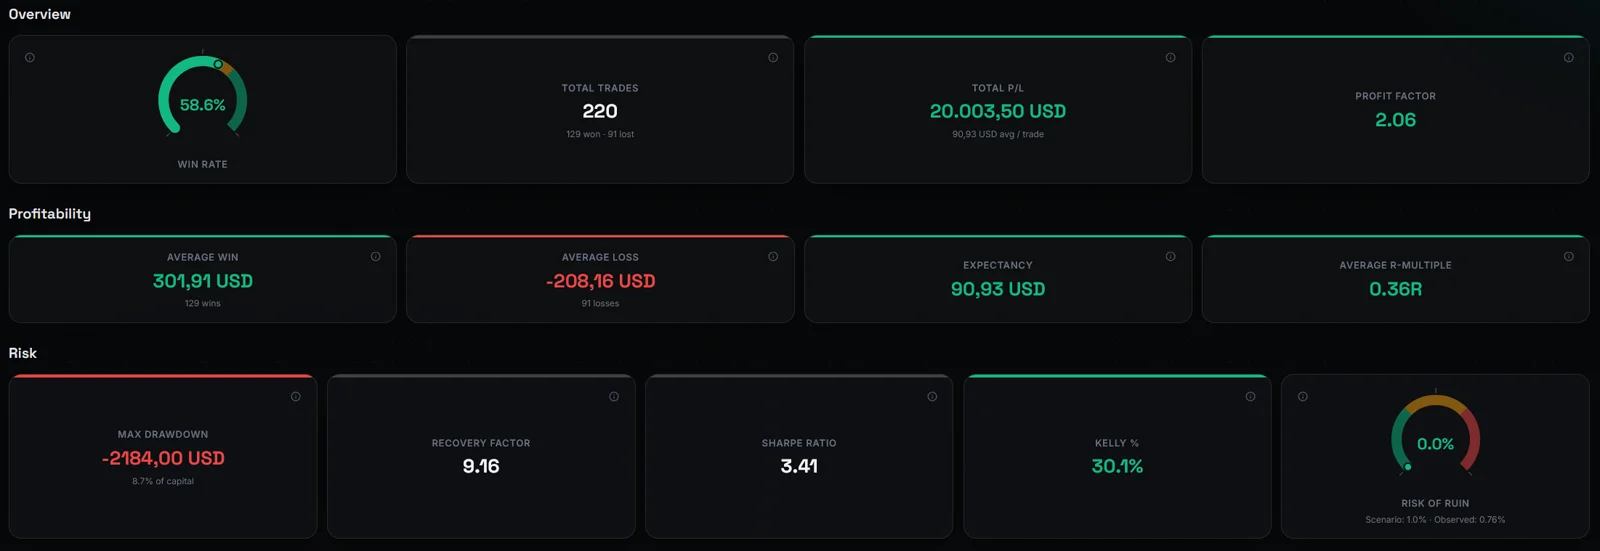
12+ metrics computed live from every trade — win rate, profit factor, Risk of Ruin, Kelly % — the moment you log one.
Trade journal
Edgebook turns your trade history into the numbers that actually matter — win rate, profit factor, Risk of Ruin — the same way a broker turns activity into a statement. An AI coach reads those same figures and tells you what to fix.
Read the formulas ↓ 01A spreadsheet won't calculate your Risk of Ruin. Memory won't tell you which strategy is quietly losing money — that's not a character flaw, it's a documented bias. Here's what actually keeps score.
Every closed trade updates win rate, profit factor, expectancy, R-multiple, Sharpe Ratio and Risk of Ruin automatically — no formula to maintain by hand.
Prop firm, personal account, forex, futures — each keeps its own isolated statistics, and you can compare strategies against each other to see where your edge really is.
Reads your real statistics — not your mood — and tells you where your position sizing is too aggressive or which strategy is quietly losing money. Ask a follow-up and it keeps the conversation going.
Equity curve, drawdown, R-multiple distribution, calendar heatmap, performance by day of week and hour — the patterns a spreadsheet hides.
Upload a CSV or Excel export from your broker and the AI reads the columns for you — review the mapping, then the preview, before anything is saved.
Five pages, for scale — Edgebook itself runs to 12+ metrics and 10 chart views, more than any screenshot can hold.
12+ metrics computed live from every trade — win rate, profit factor, Risk of Ruin, Kelly % — the moment you log one.
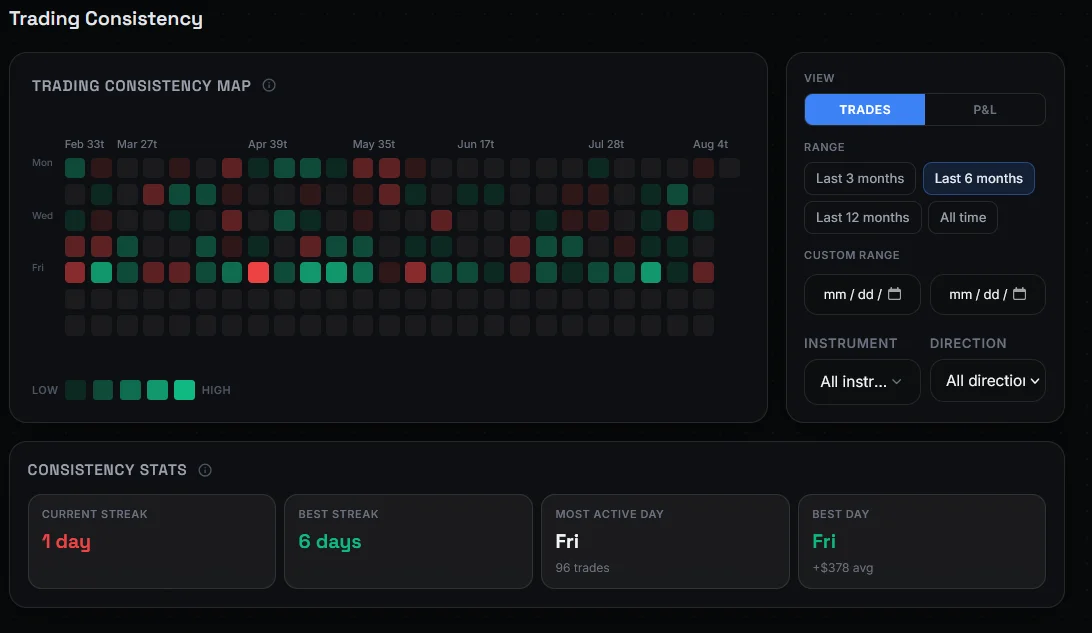
Every trading day as a heatmap, with your current streak, best streak and most active day surfaced automatically — not just P/L.
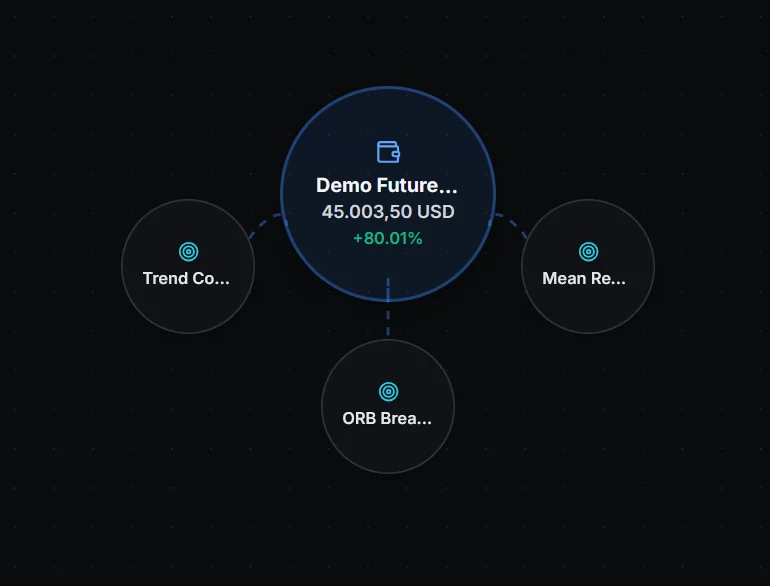
Drag a strategy between accounts and watch each one's isolated performance update in real time.
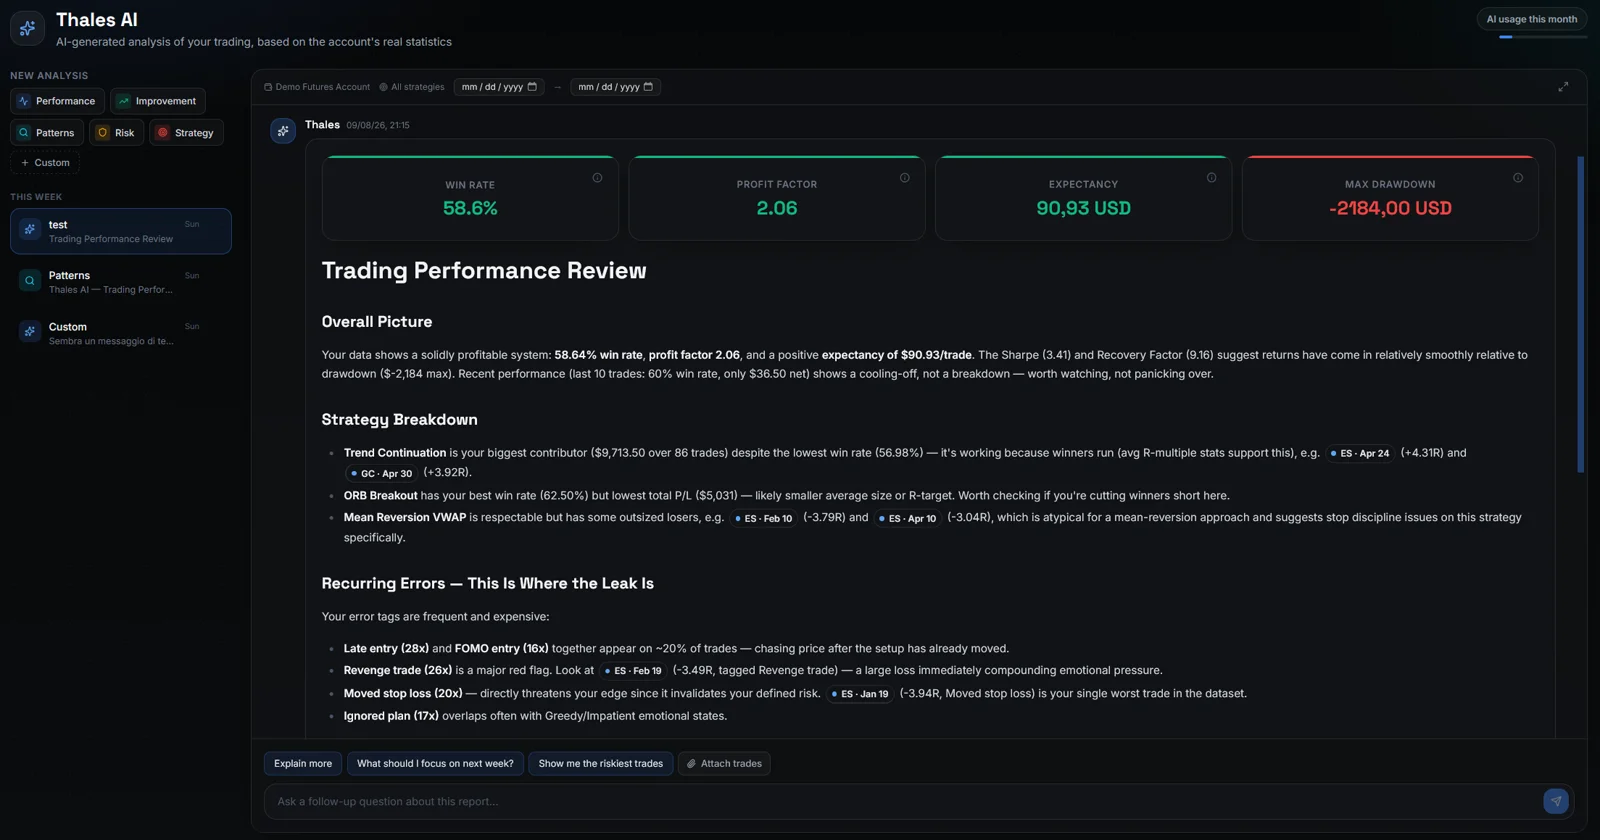
Ask a follow-up, get an answer grounded in your real numbers — not a generic chatbot guessing at your edge.
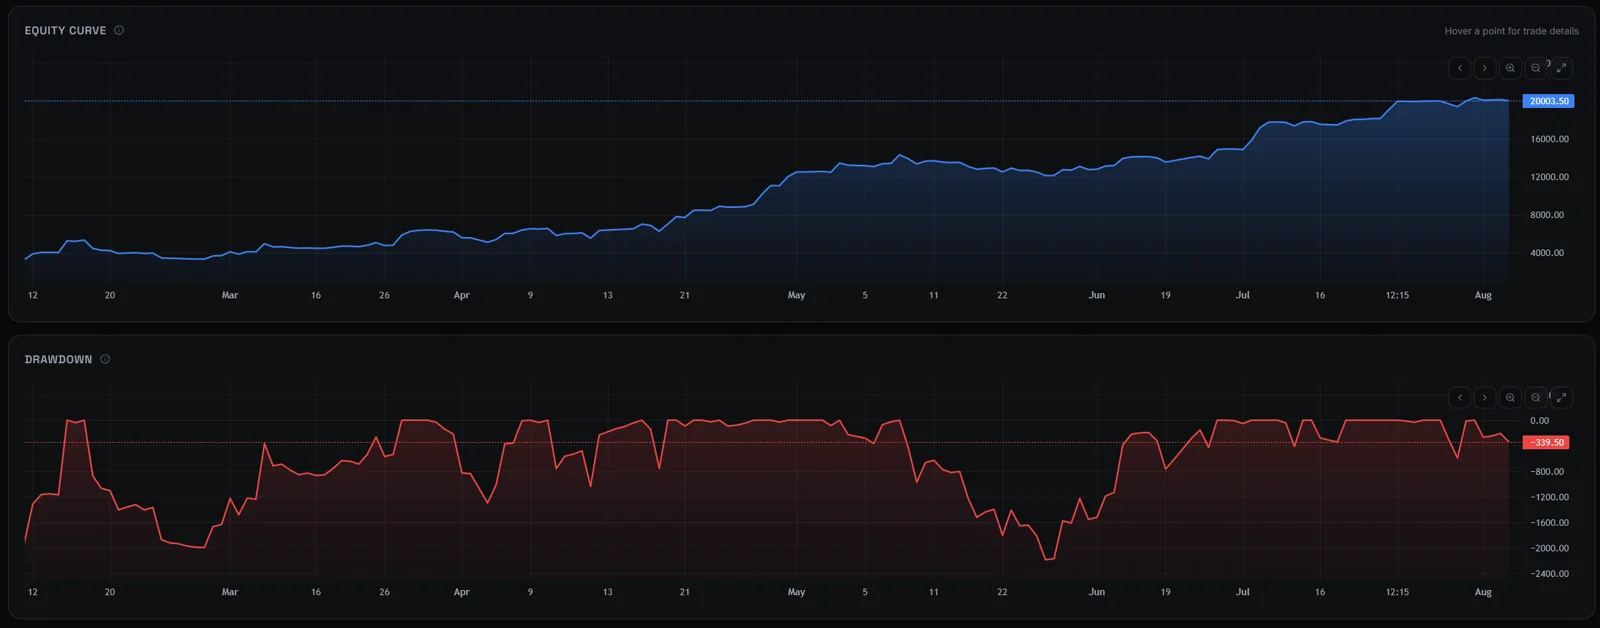
Equity curve and drawdown, always in sync with your actual trade history — hover any point for the trade behind it.
Profit Factor
Σ win / |Σ loss|
above 1.0 = profitable system
Expectancy
(W × avgWin) − (Q × |avgLoss|)
expected value per trade
Sharpe Ratio
(R̄ − Rf) / σ × √days
risk-adjusted return
Risk of Ruin
Edge = W·Payoff − L, RoR = ((1−Edge)/(1+Edge))^N
gambler's ruin model (Feller/Balsara) — odds of blowing up the account
Yes. Your trades are yours — export the full journal to Excel whenever you want, no lock-in.
The classic gambler's-ruin model (Feller, formalized for trading by Balsara) — not a heuristic. Same math used by risk desks, applied to your win rate, payoff ratio and position size.
Yes — prop firm, personal, forex, futures, however many you run. Each account keeps isolated statistics, and you can compare strategies side by side.
Your real statistics — win rate, sizing, Risk of Ruin, which strategies underperform. It reads numbers, not charts, and it doesn't predict where price goes next.
Free to start during the private beta. You'll need an invite code — request one below.
Your next trade deserves to be on the record.
Tell us a bit about yourself and we'll email you an invite code — usually within a day or two.